

Cape Coral continues to rank among the nation’s preferred destinations for international home shoppers even as foreign demand for U.S. real estate shows signs of cooling, according to Realtor.com’s latest International Demand report.
The Cape Coral-Fort Myers metro placed 13th nationally, with 1.4% of all international U.S. home-search traffic, and remained heavily favored by Canadian homebuyers, who accounted for 61.4% of the area’s foreign search activity. International shoppers in the region also tended to view higher-priced listings, with a median price of $410,483, about 2.8% more than the median viewed by domestic shoppers.
The strong global interest comes at a moment when national foreign demand is slipping. International shoppers made up 1.5% of U.S. online home-search traffic in the third quarter of 2025, down modestly from 1.6% one year earlier. The level remains above the 1.2% pre-pandemic share recorded in 2019, suggesting that even with slowing activity, global engagement in U.S. housing markets remains comparatively elevated.
Economists point to a mix of geopolitical and financial pressures shaping the shift. “Global economic uncertainty, policy shifts, and the resulting exchange rate fluctuations are creating mixed conditions for international buyers,” said Danielle Hale, chief economist at Realtor.com. “These factors have led to some moderation in foreign demand for U.S. homes compared to last year. Still, interest remains above pre-pandemic levels, reflecting ongoing engagement from global home shoppers in key U.S. markets.”

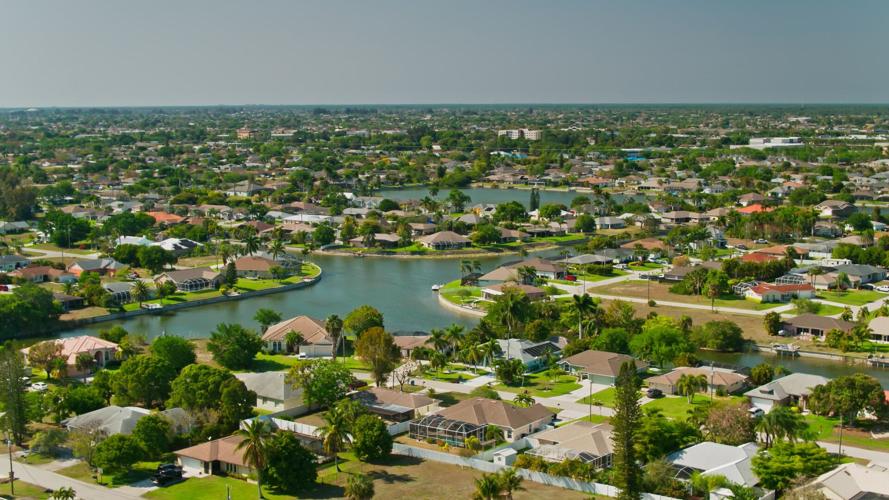
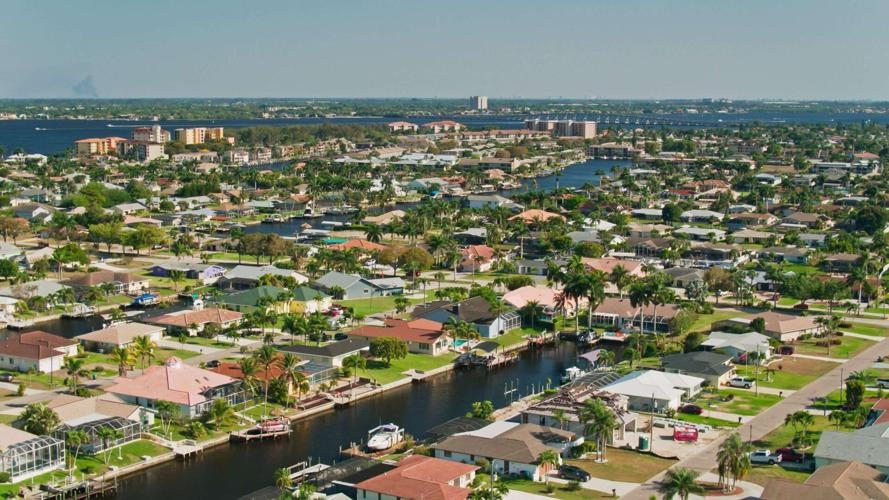
Single-family homes line freshwater canals in a Cape Coral neighborhood, where foreclosure activity remains elevated compared with national levels, according to recent housing market data.
Canada remains the top source of international traffic to the U.S. but its share has declined sharply — from 36.6% in the third quarter of 2024 to 32.1% this year. The drop coincided with U.S. tariffs on Canadian goods and significant exchange-rate volatility, adding financial friction for cross-border buyers. Still, Canadians remained dominant in several markets, including Phoenix (61%), North Port (58.8%) and Detroit (51.4%).
The report also found that international shoppers continue to favor pricier homes. Across the 20 most popular U.S. metros, the median home viewed by international buyers was 29.8% more expensive than those viewed by domestic shoppers, though that gap has narrowed from the 34.2% average between 2022 and 2024. Markets like Los Angeles, New York, San Francisco and Boston posted the largest disparities, underscoring their position as global luxury hubs.
Miami remained the leading destination for international shoppers, drawing 8.4% of foreign online views, followed by New York (5.6%) and Los Angeles (4.8%).
Looking ahead, economists say U.S. immigration policy will play a major role in shaping future demand. “Proposed ‘gold’ and ‘platinum visa’ programs may draw more high-net-worth buyers to luxury markets, while restrictions on H-1B visas could weigh on demand in innovation-driven metros such as Austin and San Jose,” said Jiayi Xu, senior economist at Realtor.com.
Top 20 Markets Loved by International Home Shoppers (2025 Q3)
Rank | Market | Traffic Share | Median Viewed (International) | Median Viewed (Domestic) | Price Difference (%) 2025 Q3 | Price Difference (%) 2022–24 |
|---|---|---|---|---|---|---|
1 | Miami–Fort Lauderdale–West Palm Beach, FL | 8.4% | $546,633 | $566,167 | -3.5% | -3.1% |
2 | New York–Newark–Jersey City, NY-NJ | 5.6% | $1,029,333 | $690,000 | 49.2% | 49.3% |
3 | Los Angeles–Long Beach–Anaheim, CA | 4.8% | $3,276,317 | $1,197,667 | 173.6% | 200.4% |
4 | Orlando–Kissimmee–Sanford, FL | 2.7% | $454,967 | $454,633 | 0.1% | 2.1% |
5 | Dallas–Fort Worth–Arlington, TX | 2.7% | $543,667 | $484,933 | 12.1% | 14.7% |
6 | Houston–Pasadena–The Woodlands, TX | 2.3% | $405,000 | $362,667 | 11.7% | 15.1% |
7 | Tampa–St. Petersburg–Clearwater, FL | 2.3% | $414,467 | $417,497 | -0.7% | 3.3% |
8 | Chicago–Naperville–Elgin, IL-IN | 1.9% | $431,300 | $392,967 | 9.8% | 11.3% |
9 | Phoenix–Mesa–Chandler, AZ | 1.9% | $588,000 | $540,330 | 8.8% | 5.4% |
10 | Atlanta–Sandy Springs–Roswell, GA | 1.5% | $481,666 | $448,300 | 7.4% | 14.4% |
11 | Detroit–Warren–Dearborn, MI | 1.5% | $342,717 | $351,600 | -2.5% | 4.3% |
12 | Riverside–San Bernardino–Ontario, CA | 1.4% | $647,967 | $596,933 | 8.5% | 15.3% |
13 | Cape Coral–Fort Myers, FL | 1.4% | $410,483 | $399,300 | 2.8% | 5.6% |
14 | North Port–Bradenton–Sarasota, FL | 1.3% | $461,667 | $486,633 | -5.1% | -1.7% |
15 | Boston–Cambridge–Newton, MA-NH | 1.2% | $891,000 | $719,933 | 23.8% | 26.1% |
16 | Washington–Arlington–Alexandria, DC-VA-MD-WV | 1.2% | $712,100 | $631,967 | 12.7% | 18.5% |
17 | Austin–Round Rock–San Marcos, TX | 1.1% | $648,317 | $546,667 | 18.6% | 20.7% |
18 | Philadelphia–Camden–Wilmington, PA-NJ-DE-MD | 1.1% | $437,402 | $443,300 | -1.3% | 6.6% |
19 | San Diego–Chula Vista–Carlsbad, CA | 1.1% | $1,228,983 | $1,044,663 | 17.6% | 19.2% |
20 | San Francisco–Oakland–Fremont, CA | 1.1% | $1,354,879 | $1,015,933 | 33.4% | 33.1% |
(0) comments
Welcome to the discussion.
Log In
Keep it Clean. Please avoid obscene, vulgar, lewd, racist or sexually-oriented language.
PLEASE TURN OFF YOUR CAPS LOCK.
Don't Threaten. Threats of harming another person will not be tolerated.
Be Truthful. Don't knowingly lie about anyone or anything.
Be Nice. No racism, sexism or any sort of -ism that is degrading to another person.
Be Proactive. Use the 'Report' link on each comment to let us know of abusive posts.
Share with Us. We'd love to hear eyewitness accounts, the history behind an article.